AntiMap HTML5 / ProcessingJS Simple Demo
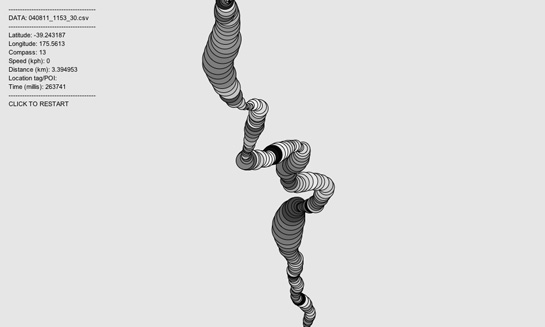
 AntiMap Simple is a HTML5/ProcessingJS demo that visualises data from the AntiMap Log mobile application. Circles are used to visualise the plotted data. The color of each circle is mapped to the compass data (0˚ = black, 360˚ = white), and the size of each circle is mapped to the speed data (bigger circles = faster).
The same data used in this demo, was used in the AntiMap Video snowboarding application. You can see from the visualisation, during heelside turns (left) the colours are a lot whiter/brighter than toeside turns (right). The sharper/more obvious colour changes indicate either sudden turns or spins (eg. the few black rings right in the centre).
Version & download links:
Click the links below for demos and source code.
Zip package below (download source) includes HTML/Javascript & sample data (040811_1153_30.csv).


[...] has two beautiful examples of how this works based on the same set of data from a snowboarder. The first example shows an HTML5 demo that translates speed and compass direction into a beautiful 3D spiral (bigger [...]
Grazi for making it nice and EZ.
[...] describes a [...]
[...] and the project currently consists of an Android and iPhone app to record information, along with Web and desktop applications that interpret [...]
[...] AntiMap Simple [...]
[...] to start by having a look on how classes are built in a code, then you can use that to manipulate Antimap’s example (Yeah, we all love free examples), or generate your own from scratch, if you aren’t a fan or [...]
[...] describes the [...]
[...] built, we need to start by having a look on how classes are built , then we use that to manipulate Antimap’s example (Yeah, we all love free examples), or generate your own from scratch, if you aren’t a fan or [...]